






US giving crossed $600 billion for the first time in 2025, and corporate giving barely moved. Two facts, one report. The interesting part is what sits between them.
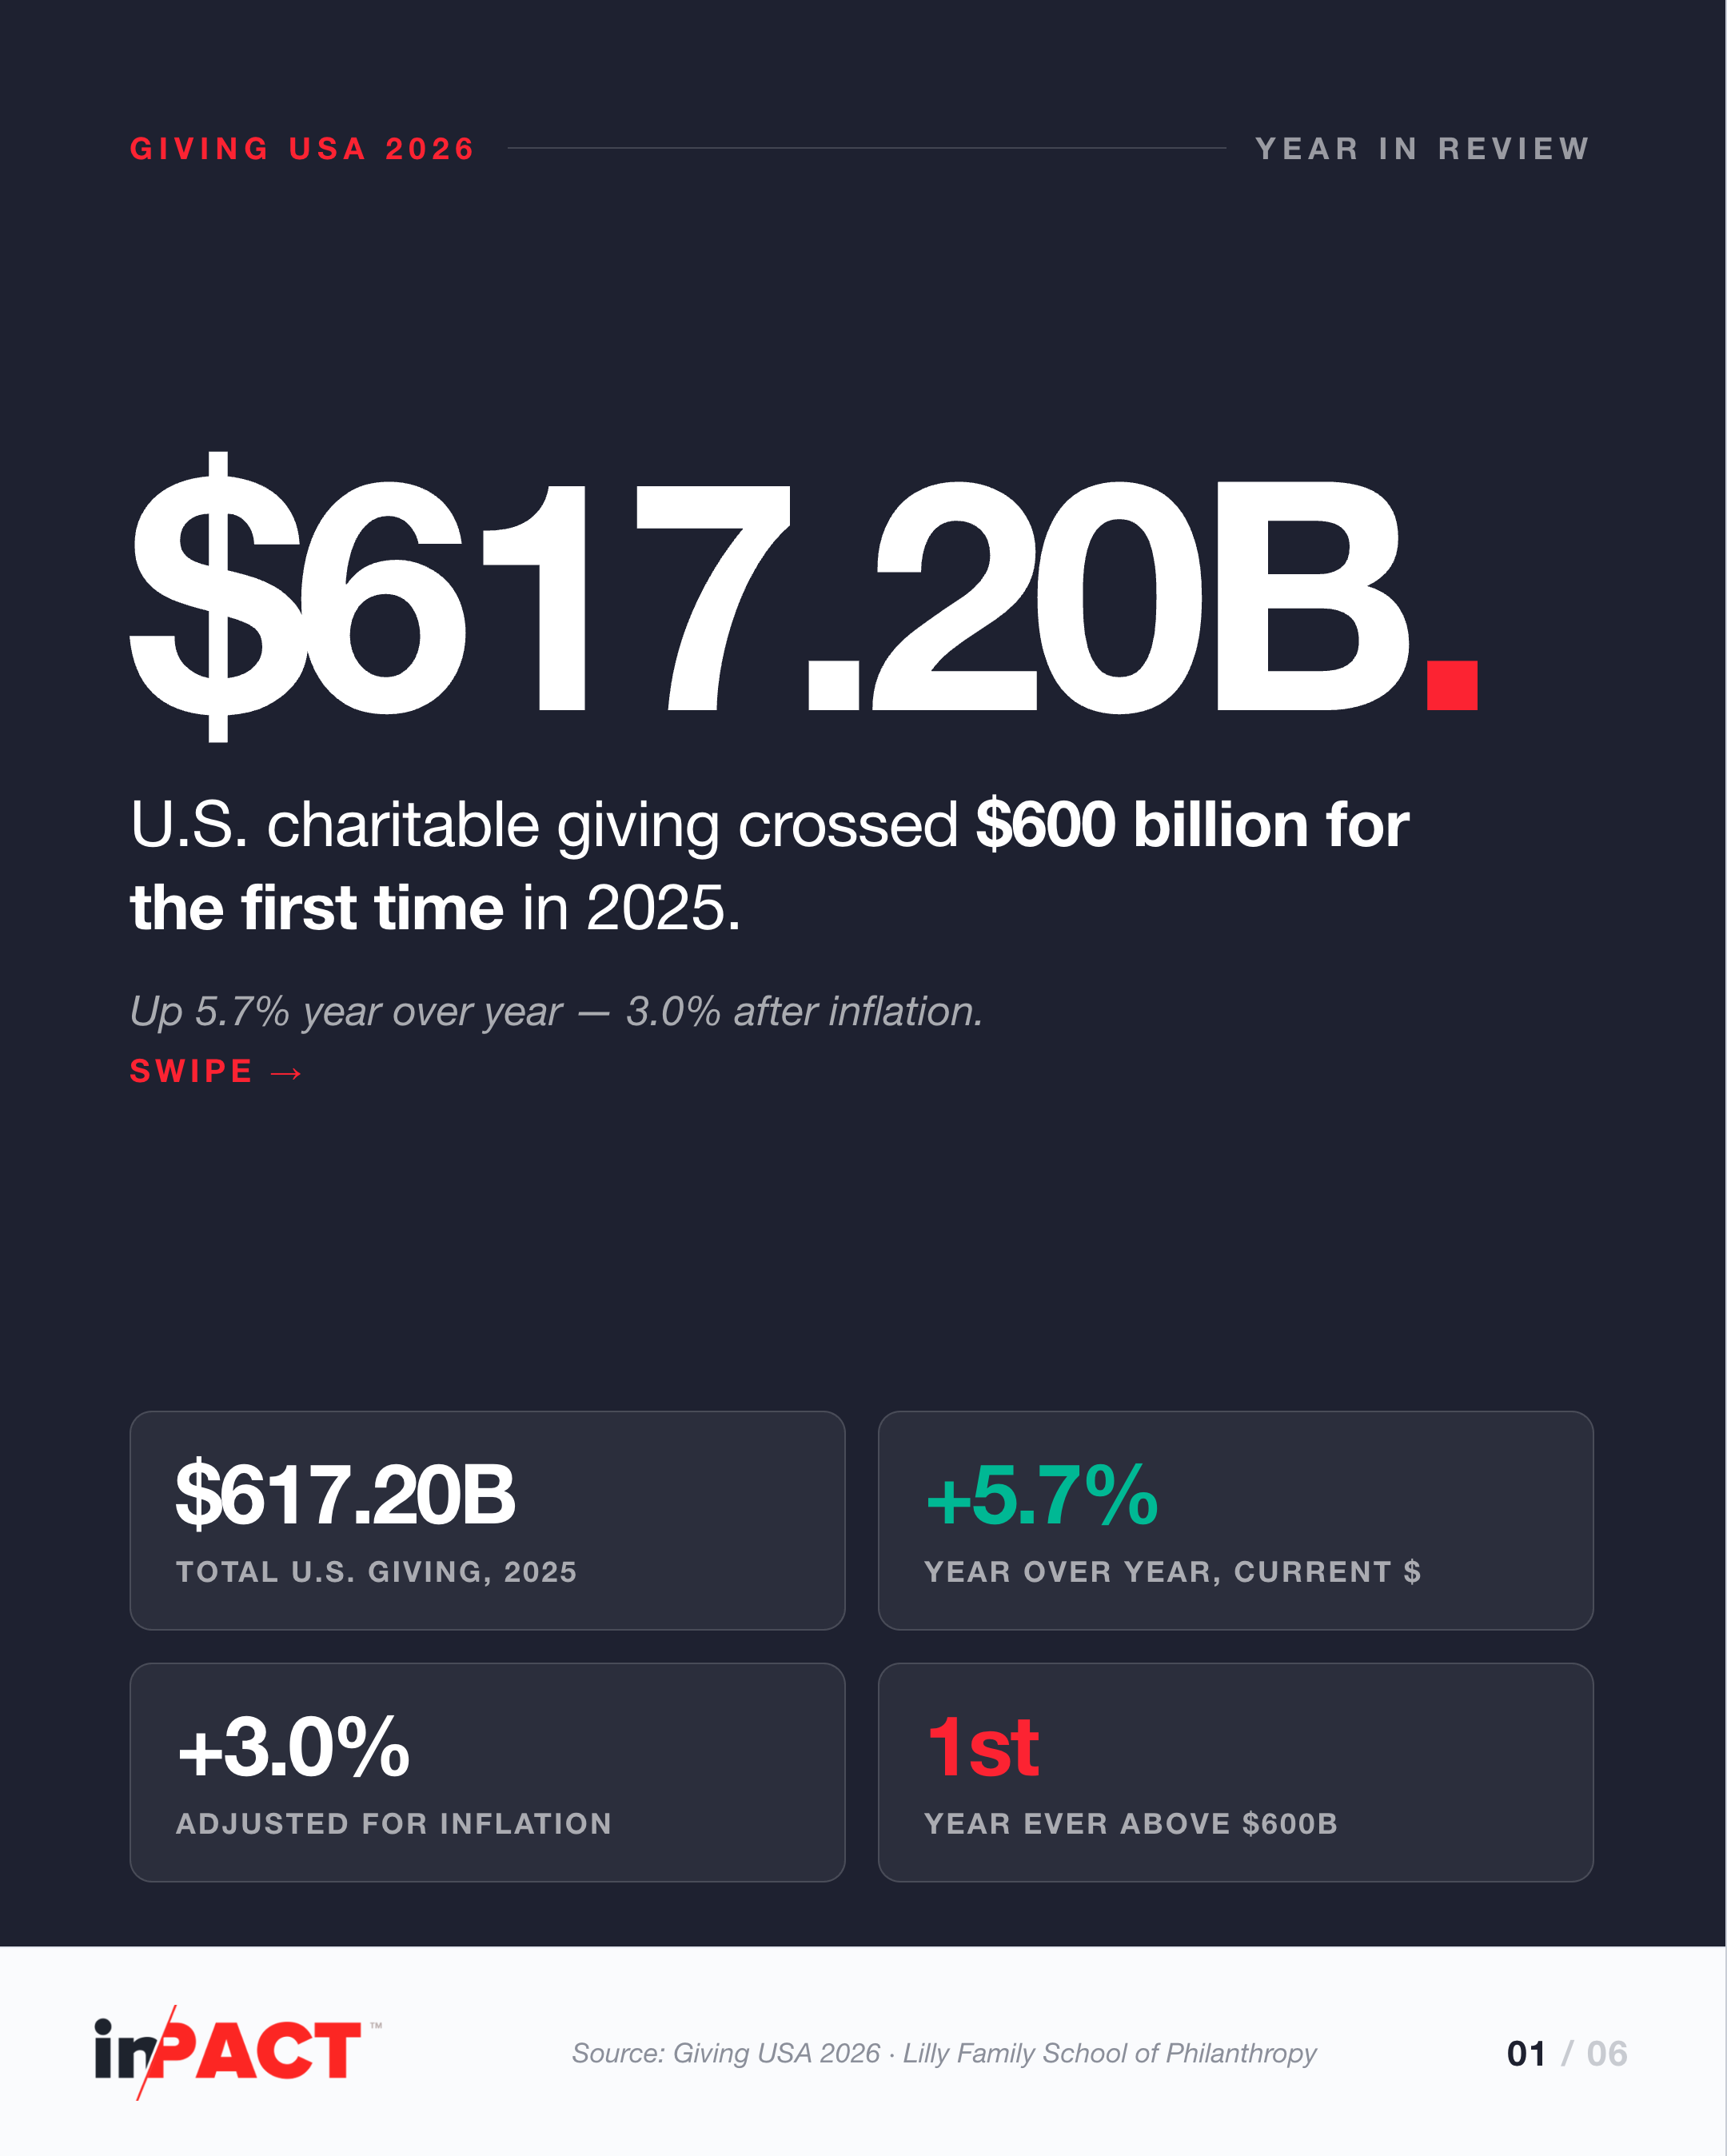
Every year, Giving USA publishes the closest thing philanthropy has to a census. The 2026 edition opens with a genuine milestone: Americans gave $617.2 billion to charity in 2025, the first time in history the total has crossed $600 billion.
Records make headlines. But the number worth sitting with is a few pages further in, and it points in a different direction. Read together, the two tell you more about where corporate giving is going than either does alone.
First, the headlines behind the number
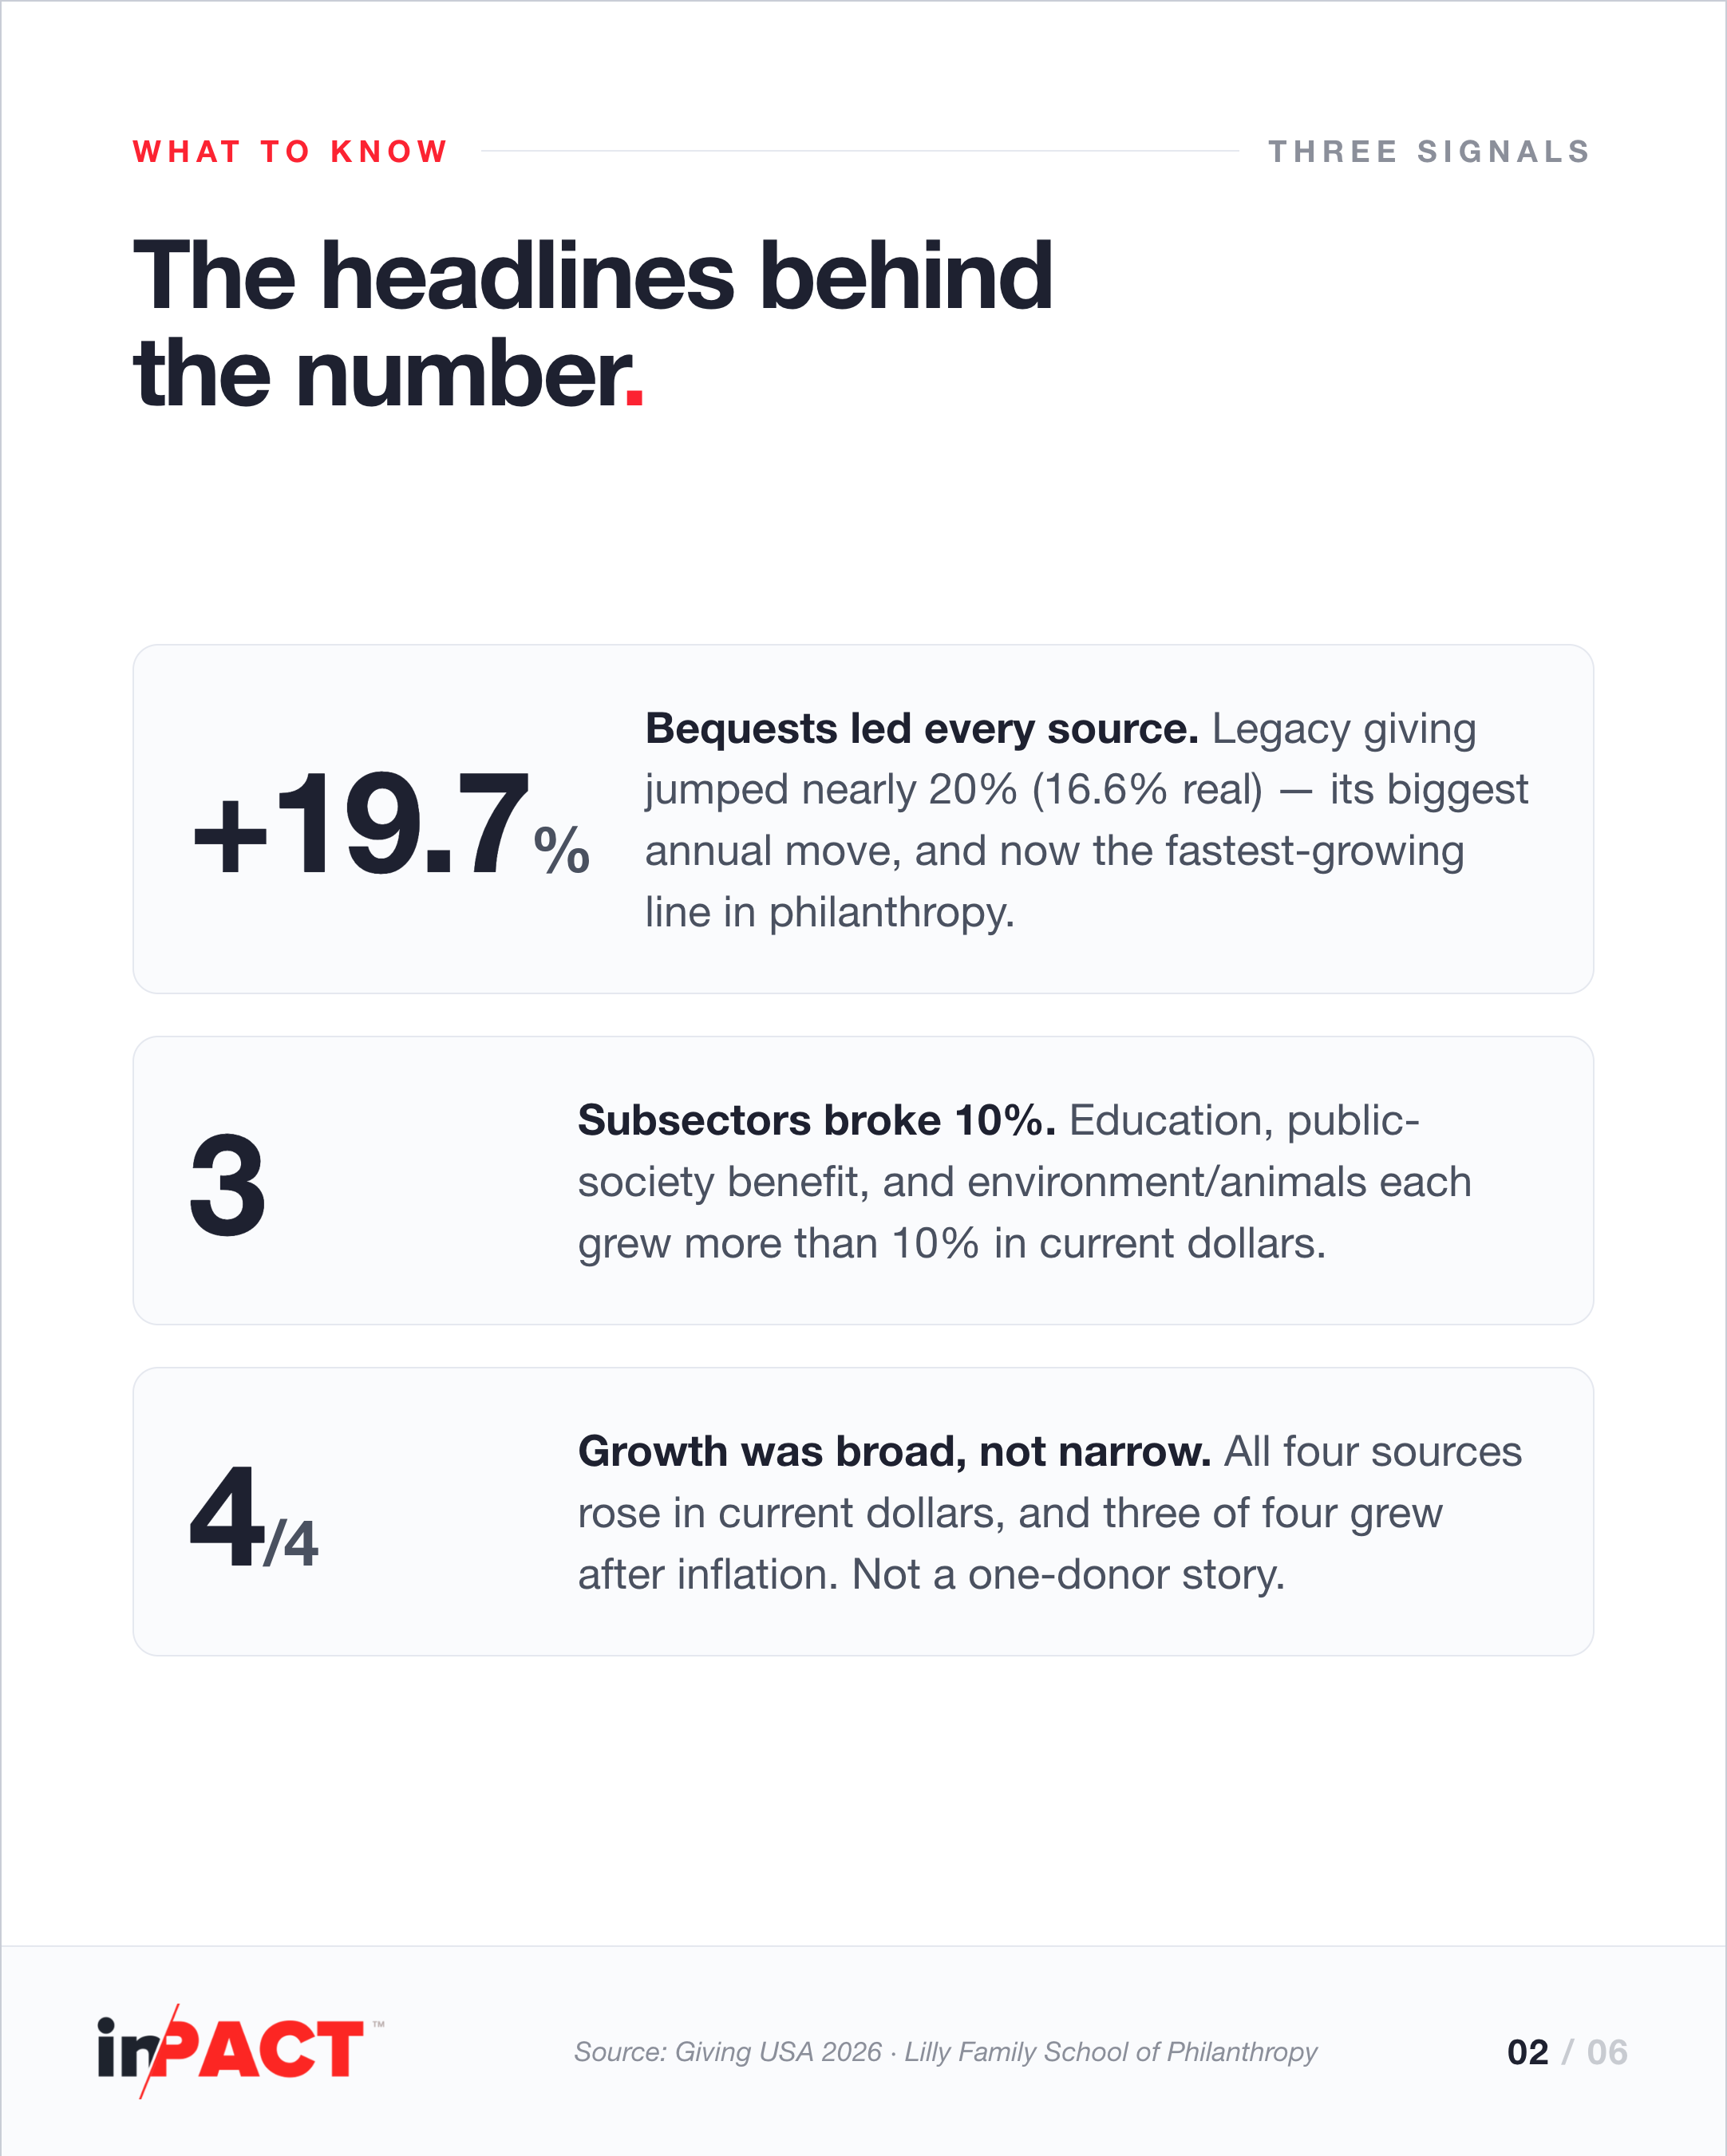
Three signals stand out before you even get to the corporate line. Bequests led every source, jumping nearly 20%, the biggest annual move in the report and now the fastest-growing line in philanthropy. Three subsectors broke 10% growth in current dollars: education, public-society benefit, and environment and animals. And the growth was broad, not narrow: all four sources of giving rose in current dollars, and three of the four grew after inflation.
Not a one-donor story, in other words. Generosity is broad-based and accelerating. Which makes the one line that didn't accelerate the most interesting line in the report.
Where the $617 billion came from
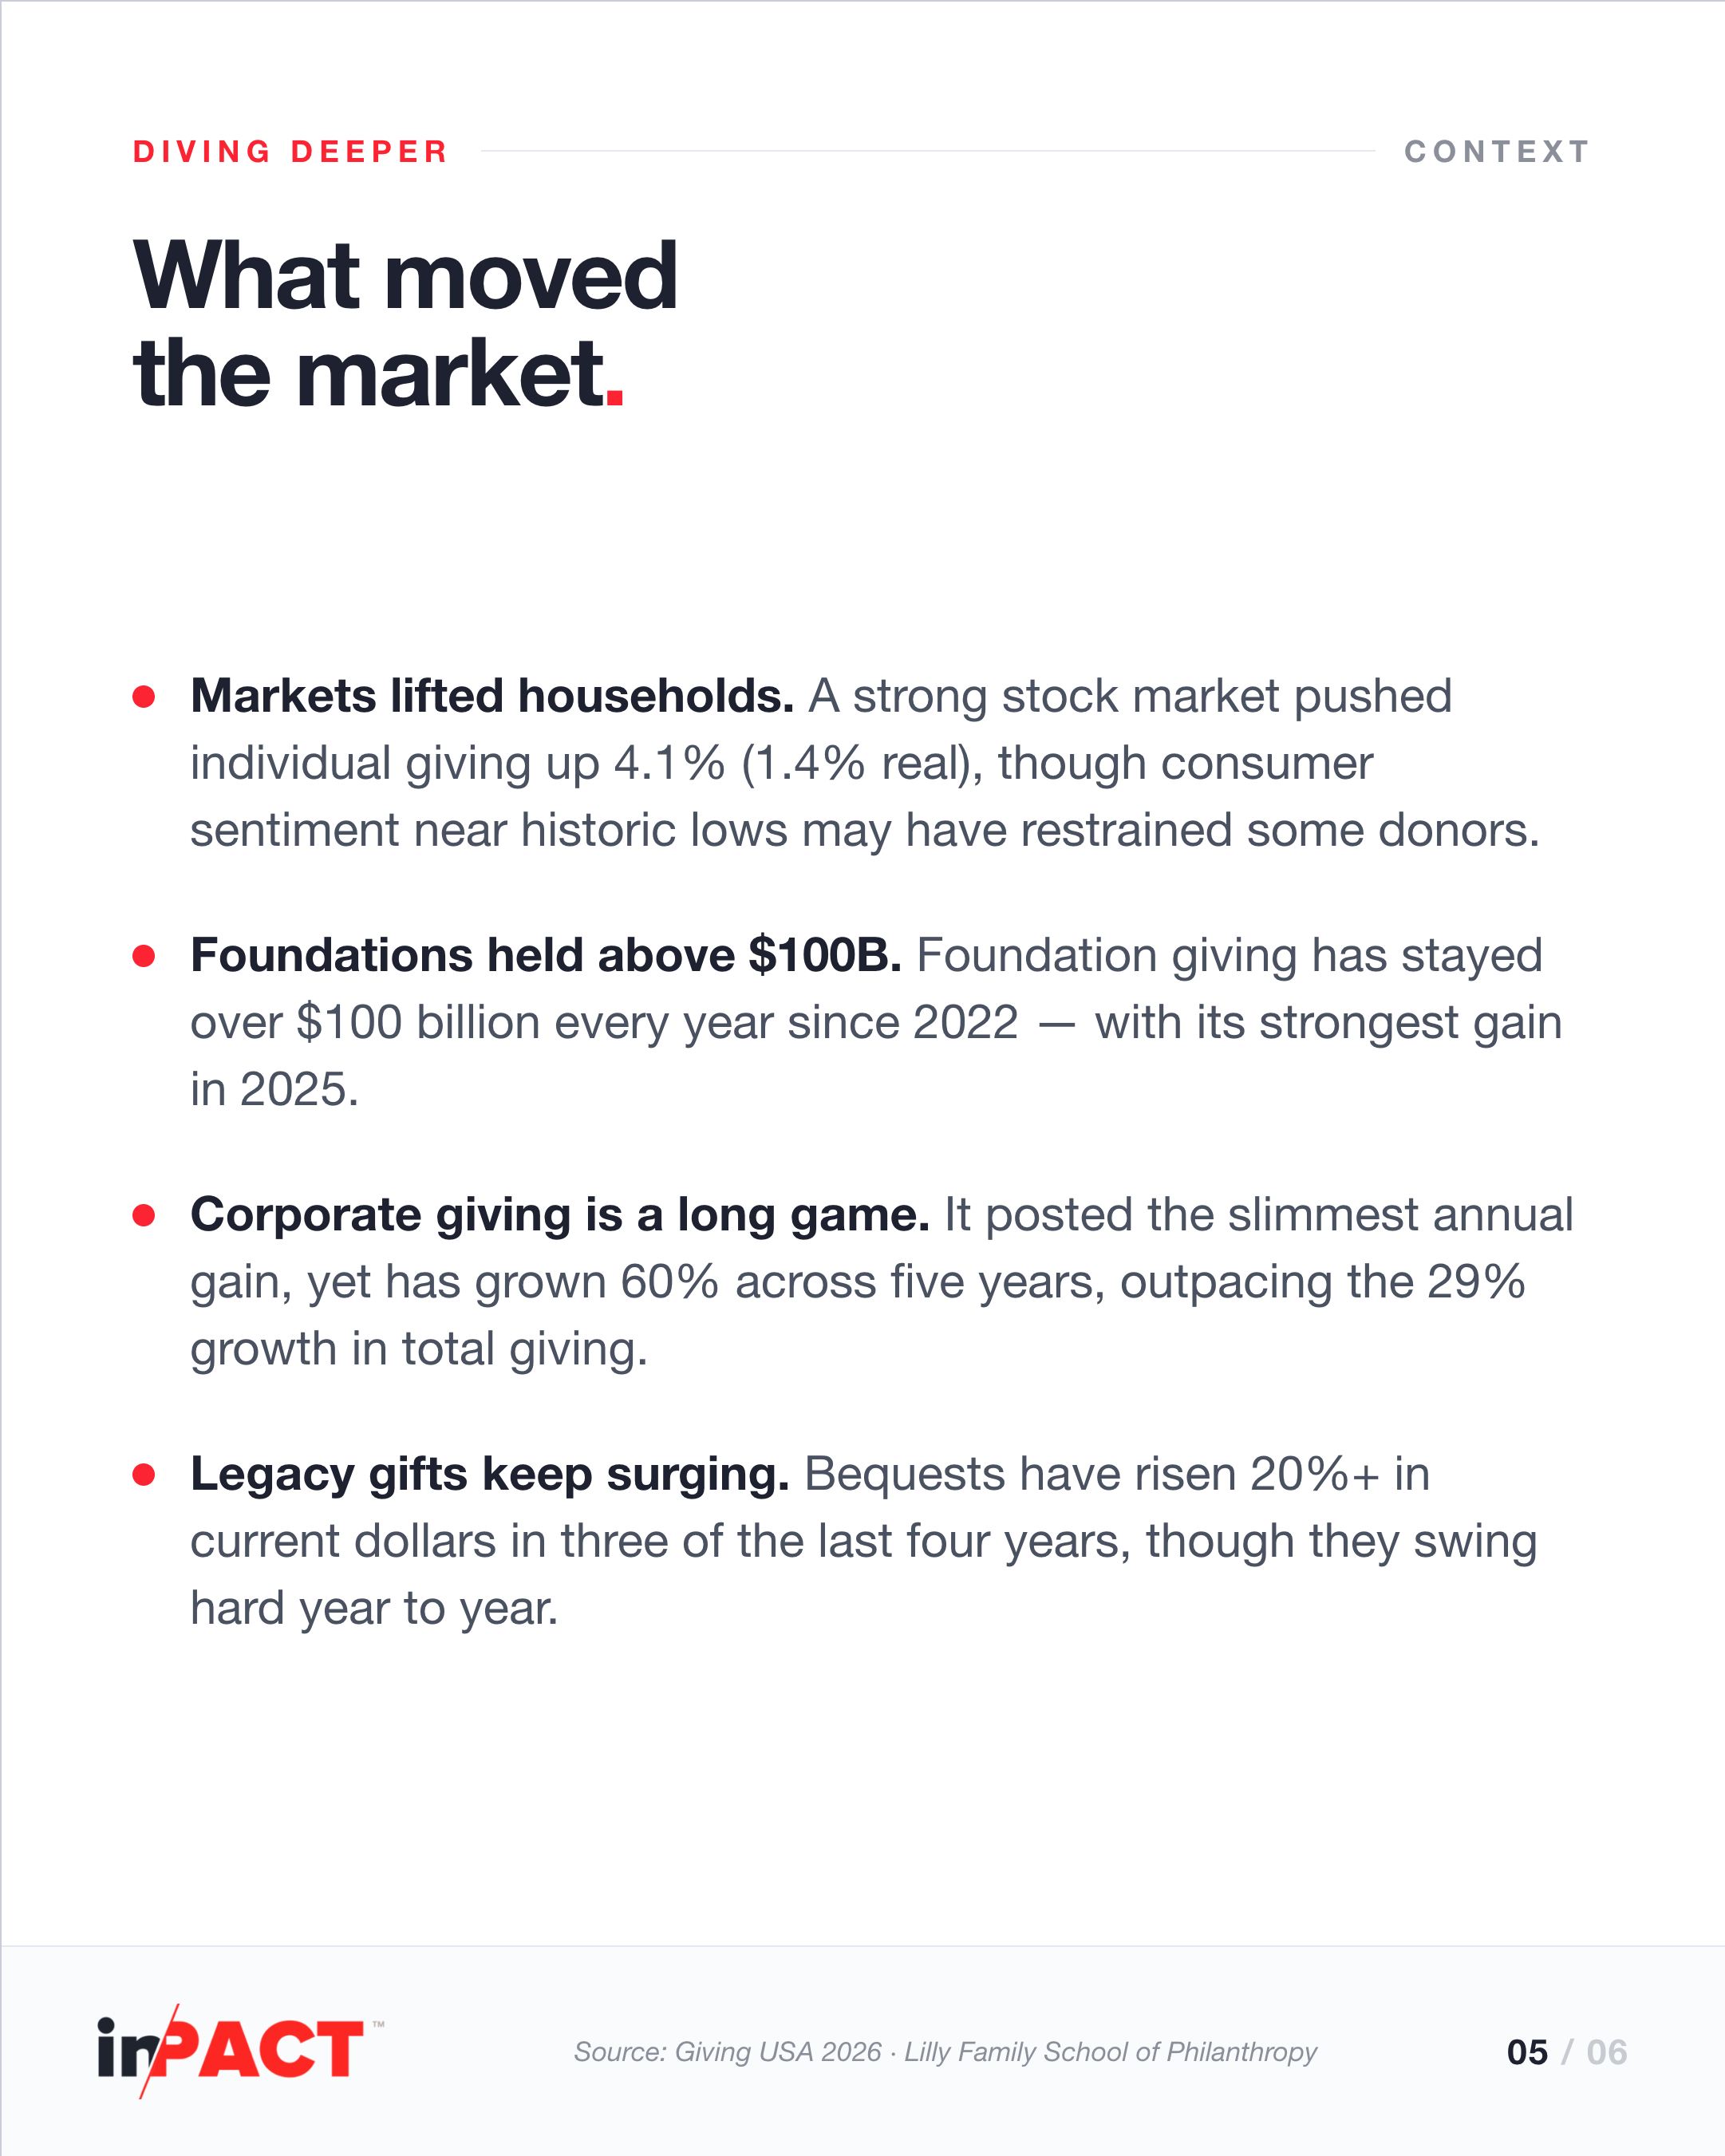
Individuals still write nearly two of every three dollars: $394.2 billion, up 4.1%. Foundations gave $117.15 billion, holding above $100 billion for the fourth straight year. Bequests hit $62.19 billion on that 19.7% surge.
And corporations gave $43.67 billion. Up 3.1% in current dollars, which after inflation rounds to +0.5%. Flat.
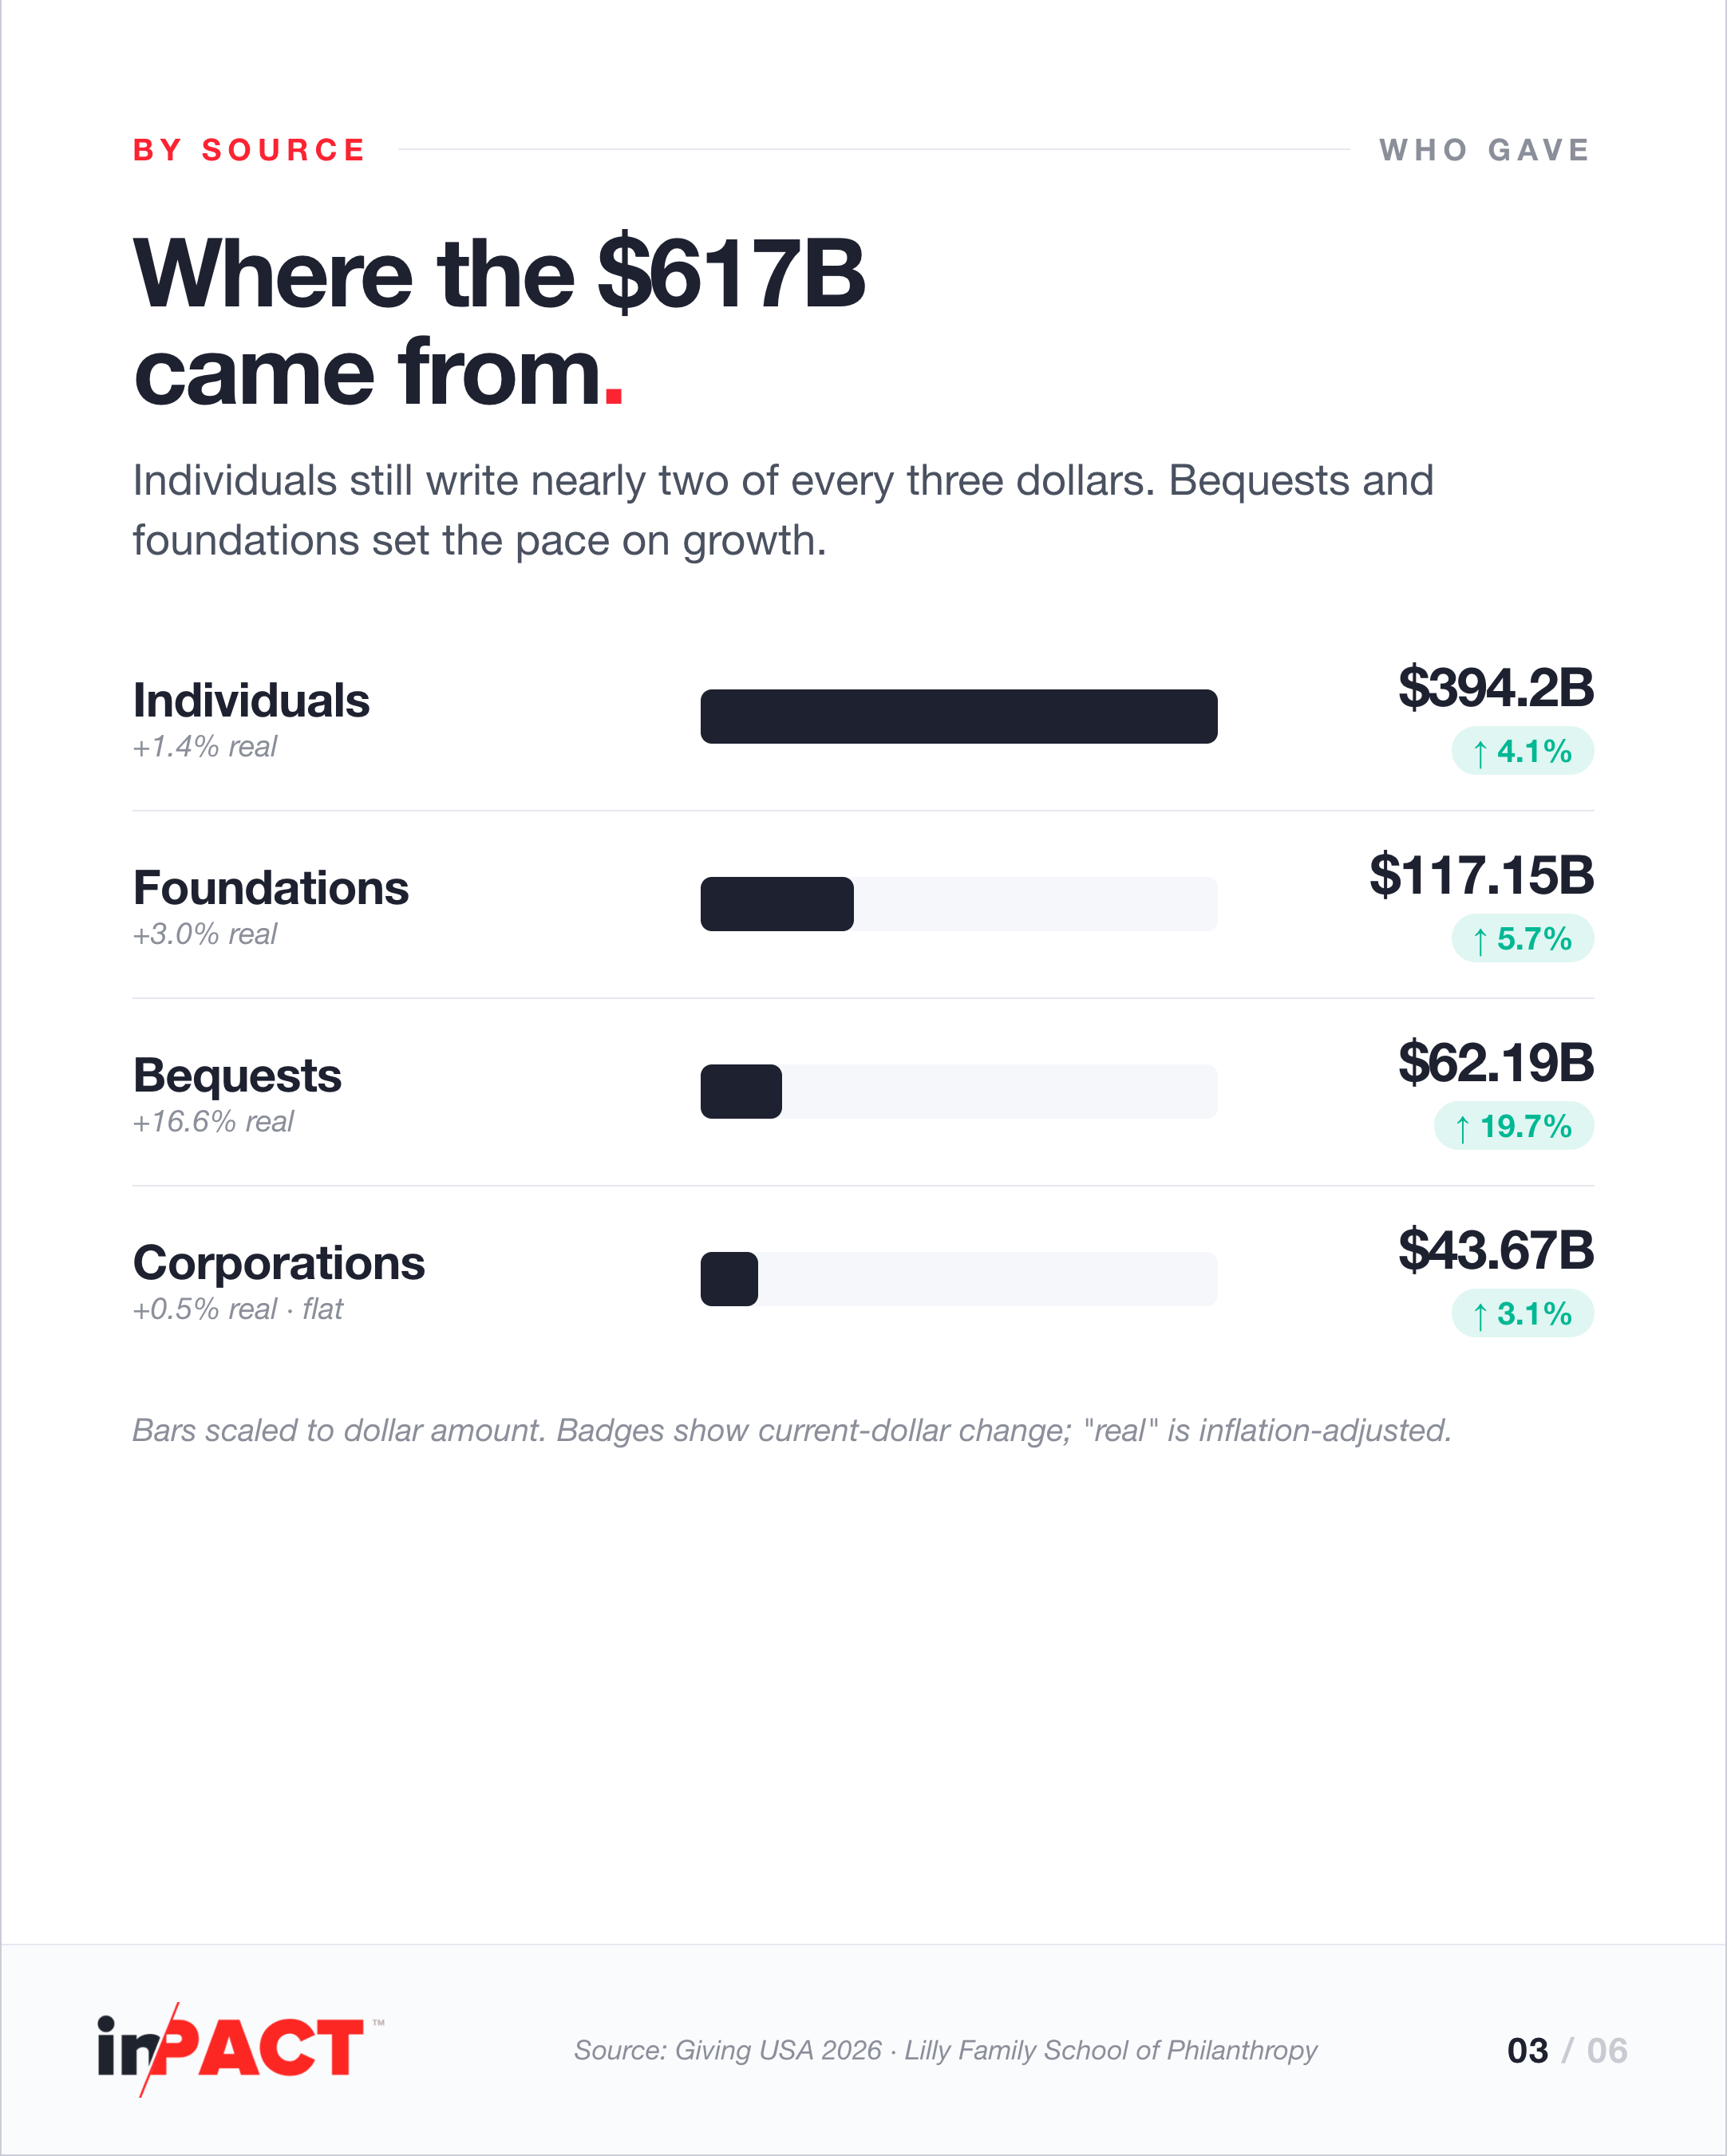
There it is. In the same year total giving set a record and every other source grew in real terms, the corporate line held almost perfectly still. Not falling. Not rising. Holding.
A record and a flat line, in the same report. That gap is not noise. Something is happening inside corporate giving that the totals don't show.
Where the money went
Before decoding the gap, one more page worth reading. Of nine recipient subsectors, eight grew. Religion remains the largest at $151.58 billion. Human services took $99.50 billion, education $92.01 billion with the strongest real growth at 8.9%. Environment and animals grew 8.2% real. The lone decline: giving to foundations, down 18.3% in real terms.
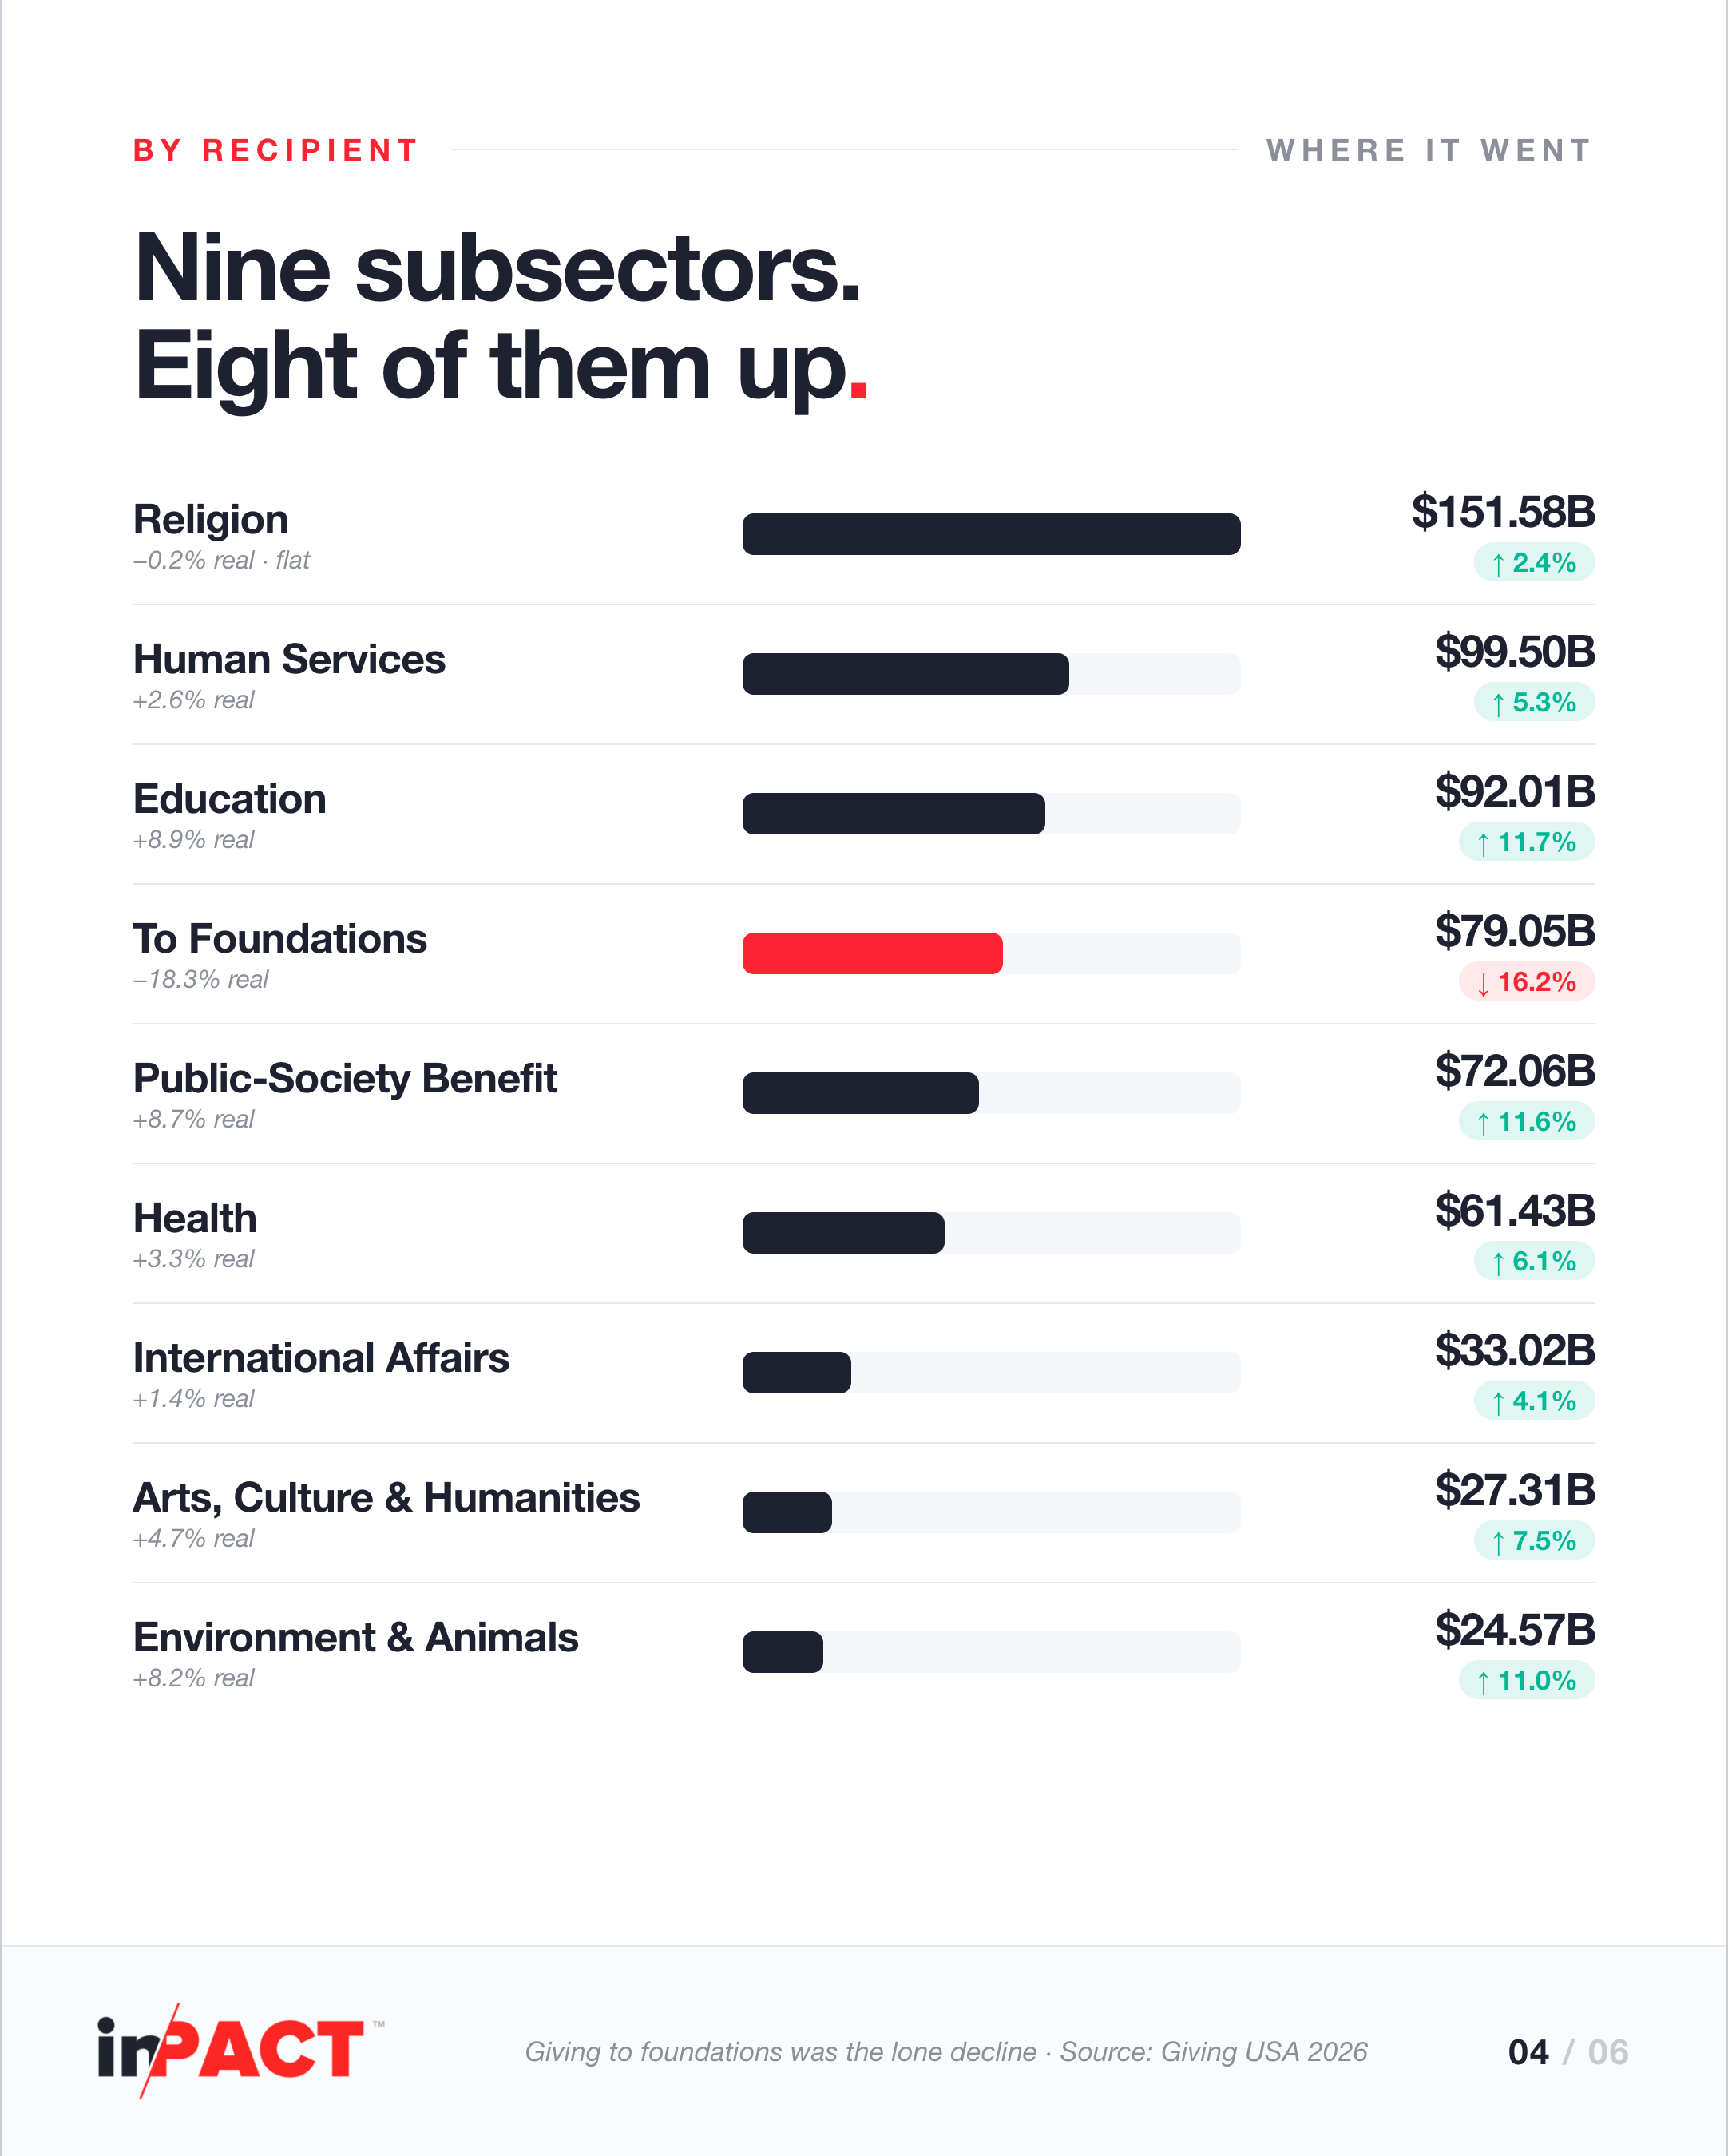
Read the pattern. Money moved toward causes with visible, near-term, local outcomes: education, human services, public-society benefit, environment. It moved away from intermediaries. Donors of every kind are choosing directness, and that preference is exactly the context in which the corporate flat line starts to make sense.
The flat line has a backstory
Zoom out and the plot thickens. Corporate giving posted the slimmest annual gain of any source, yet it has grown 60% across five years, outpacing the 29% growth in total giving. This is a line that climbed hard and then, at the top, went quiet.
Lines that do that usually have a reason. This one has two, and both arrived recently.
The first is tax. On January 1, 2026, a new 1% floor on the deductibility of corporate charitable contributions came into effect under the One Big Beautiful Bill Act. Below the floor, gifts earn no deduction, which quietly rewrites the logic of small, scattered giving. Nearly two-thirds of corporate giving leaders expect it to shape their 2026 budgets.
The second is politics. Under sustained scrutiny of DEI, companies are recomposing their portfolios, moving from contested causes toward food security, housing, affordability, digital inclusion. The dollars are similar. The shape of the giving is not.
So the flat line is not fatigue and it is not retreat. It is a pause while the rules change, the kind of pause that usually precedes a redesign.
What the gap is really measuring
Here is the reading that holds up. When a sector's spending goes flat while the pressure on it goes up, the competition doesn't stop. It moves. If the size of the check no longer separates one company from another, and in 2025 it visibly didn't, then the separation happens somewhere else.
Where? In what a company can show for the giving. Which communities the money reached. Whether anyone outside the boardroom had a say in it. Whether there is a record a board, a regulator, or a customer could actually inspect. The recipient data already shows donors of every kind rewarding directness and visibility; corporate givers are simply the last to have it demanded of them.
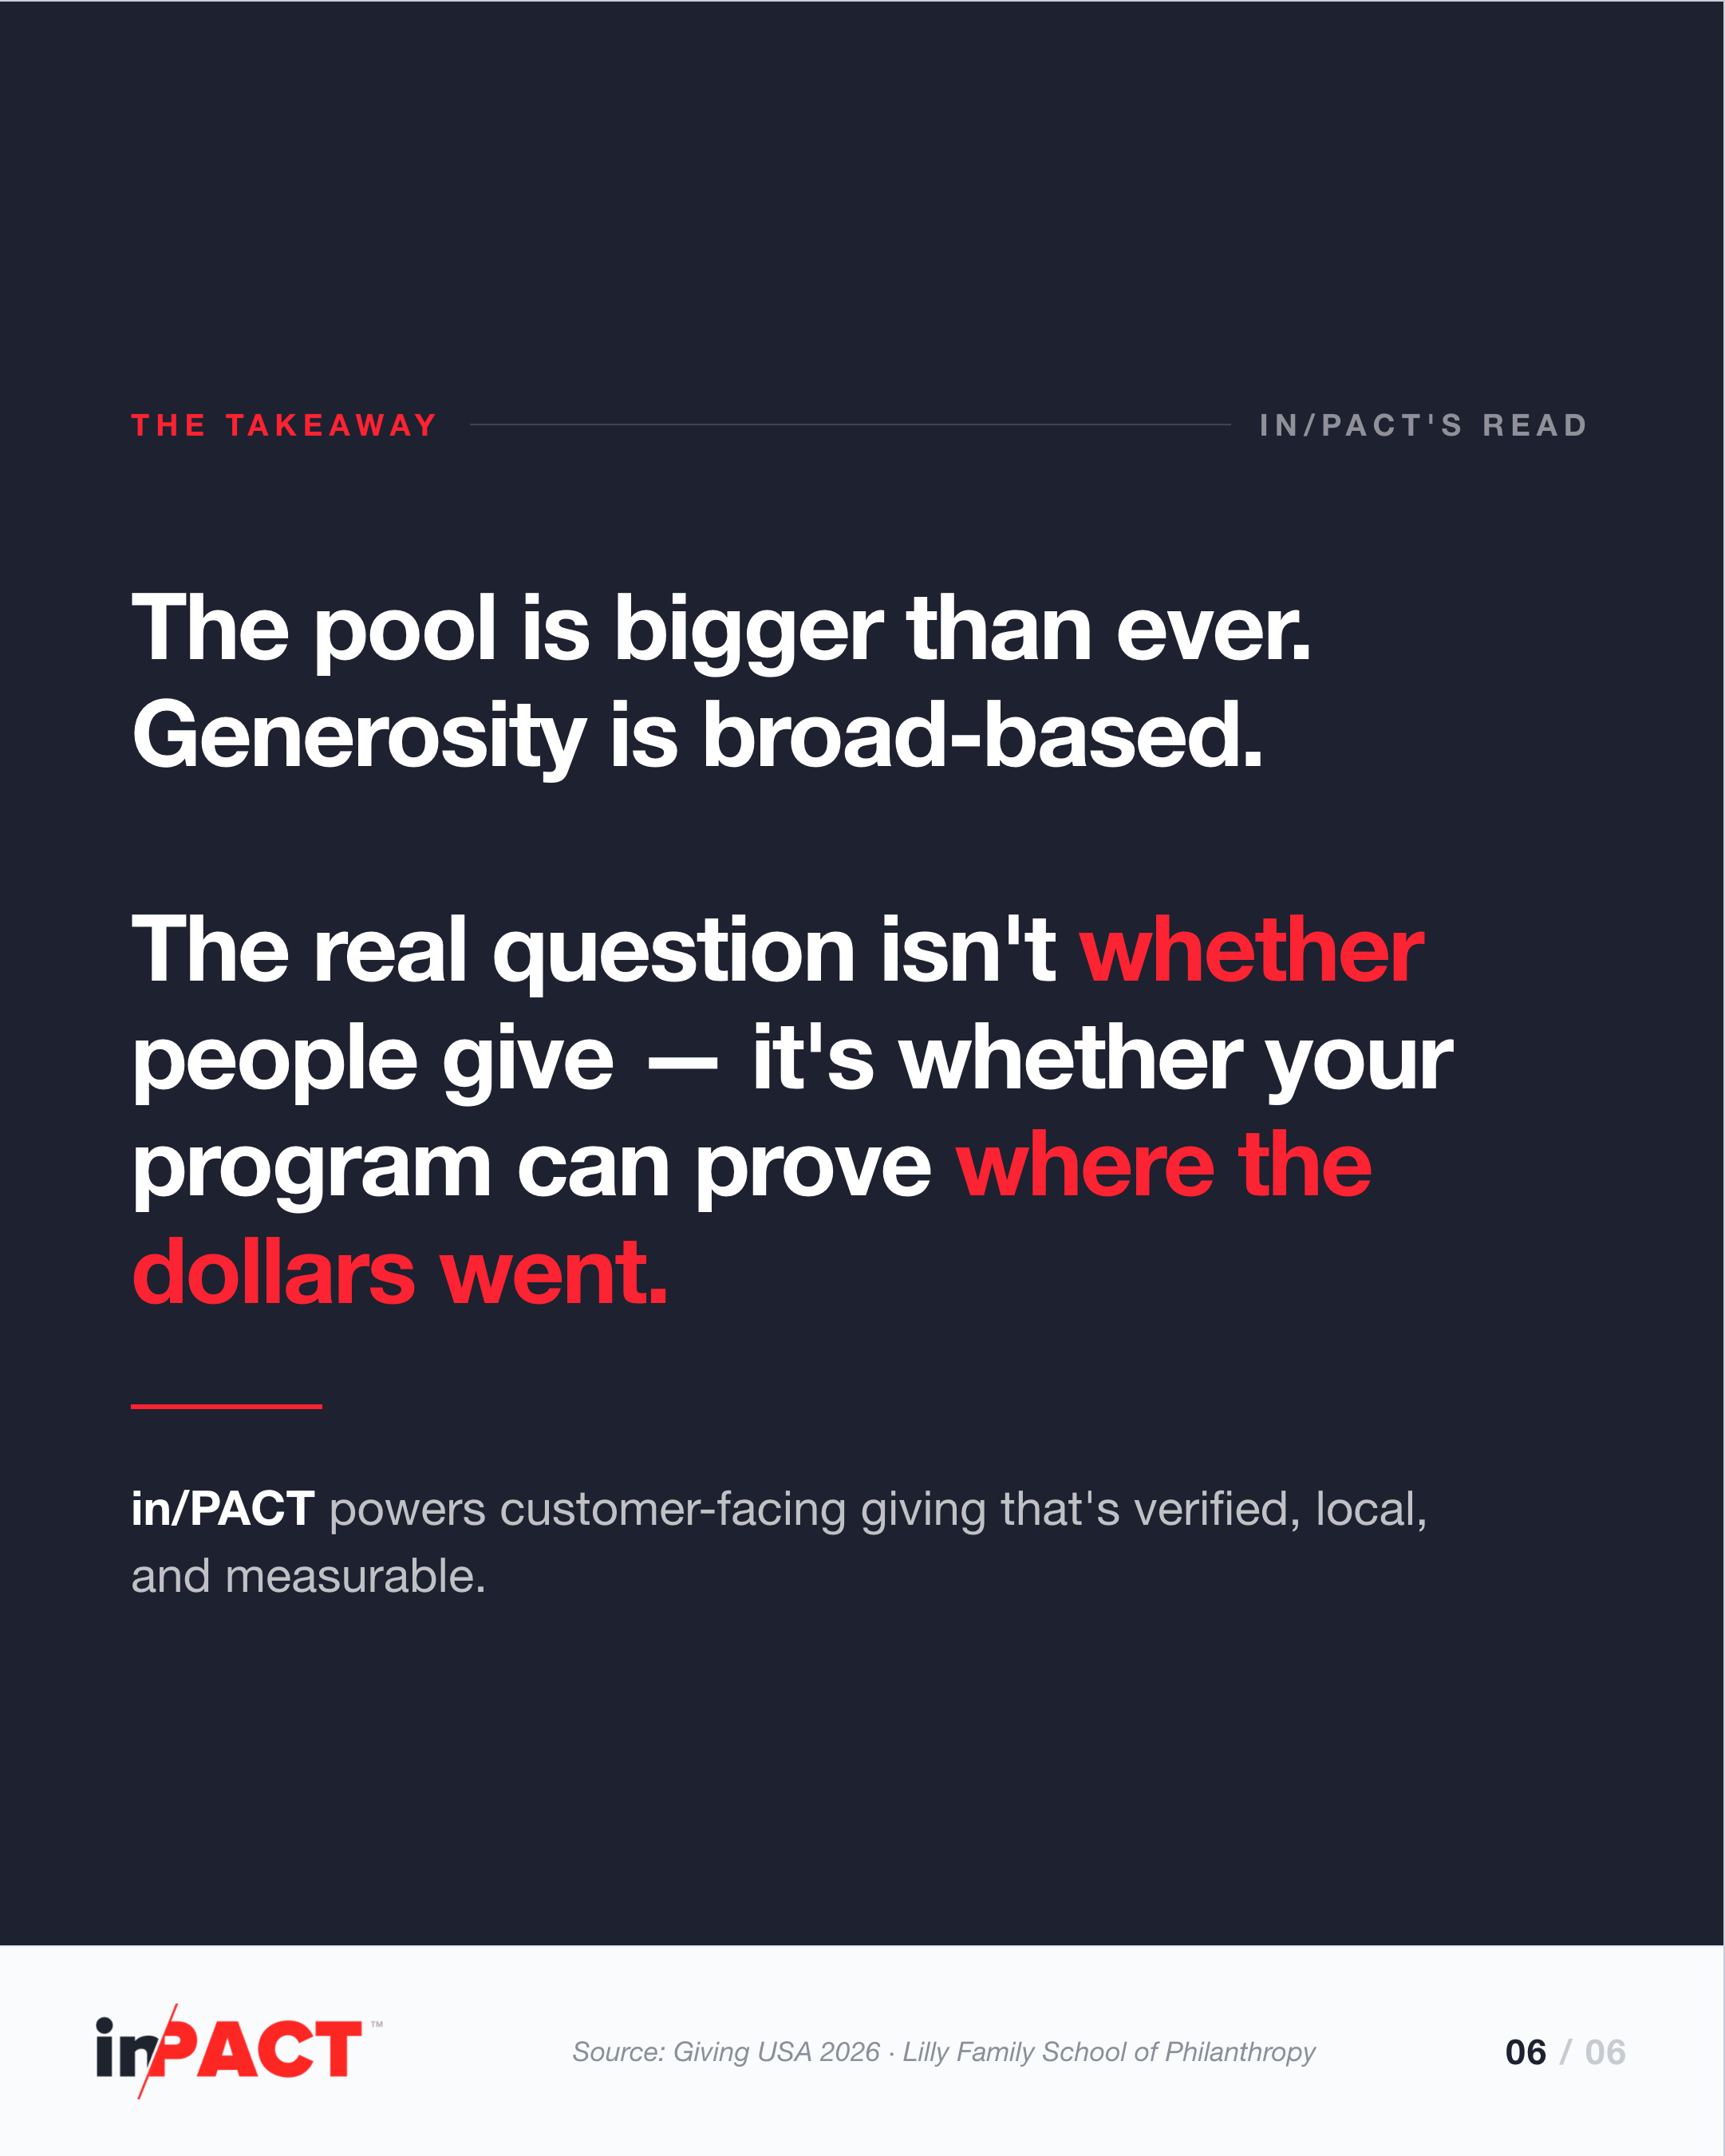
The pool is bigger than ever. Generosity is broad-based. The real question is no longer whether people give. It is whether your program can prove where the dollars went.
The question the report leaves open
Giving USA 2026 settles one question: giving, overall, is bigger than it has ever been. It opens another one, and this is the one worth taking into your next budget conversation: if corporate giving has stopped growing on the dollar axis, on what axis does it grow now?
The gap in the report is an early answer. Evidence, participation, and locality are becoming the dimensions where giving programs differ, because the dollar dimension has stopped differentiating. The companies reading the gap now are designing for it. The ones reading only the record will find out later what it meant.
Don't just give back. Give Better.
The forces behind the gap, all six of them, are mapped in our white paper "Post-DEI Corporate Giving: How Brands Can Navigate the New PESTEL Reality." Read it here: https://inpact.com/blog/why-giving-back-needs-to-become-giving-better-in-2026/
